Budget-conscious home seekers who need any whiff of hope may cheer the latest Case-Schiller national price index.
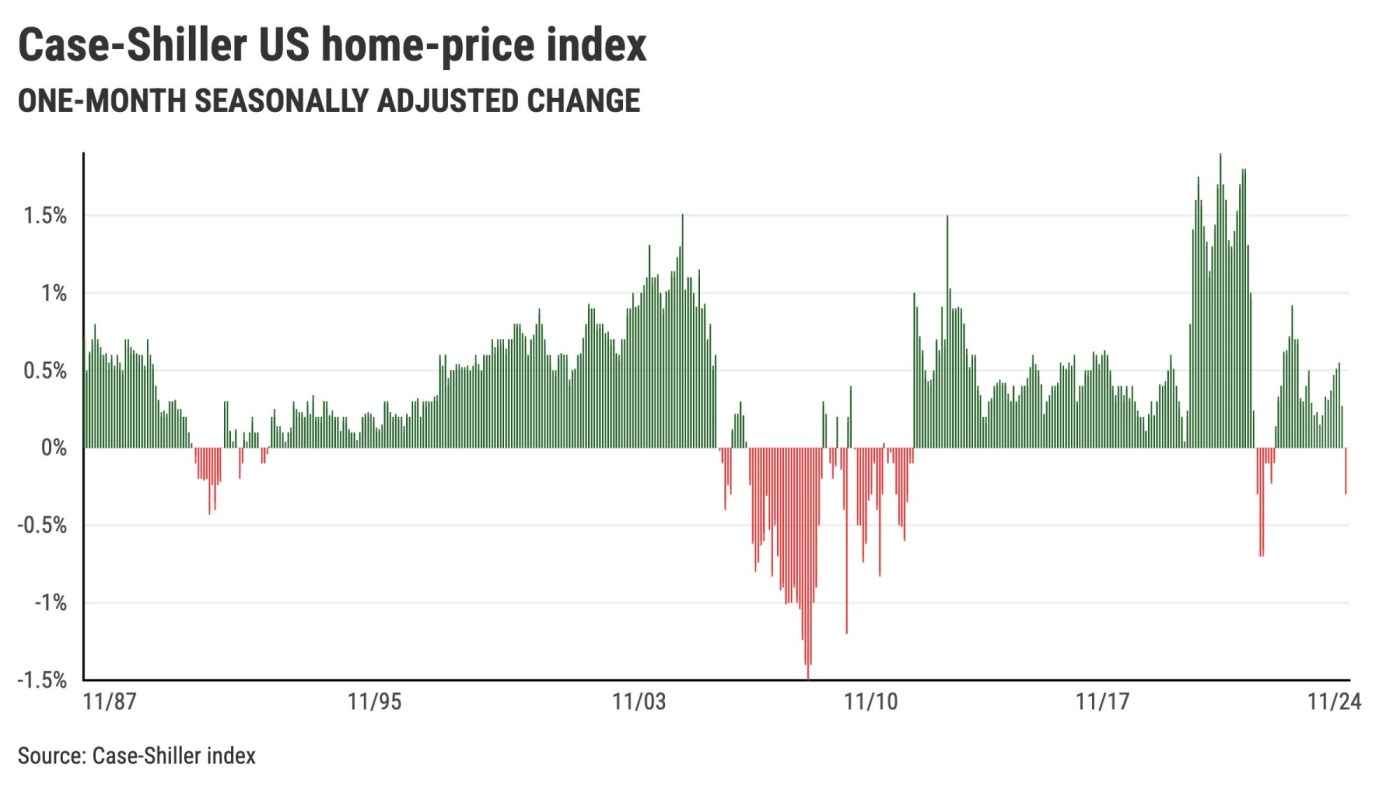
The good news is that this oft-quoted yardstick of U.S. prices declined 0.3% between February and March. It’s the first monthly dip in the “seasonally adjusted” version of the index since January 2023.
Now, grand pronouncements shouldn’t be based on such a short-run decline. But it’s a noteworthy end to a winning streak for prices that helped make housing totally unaffordable across the nation.
Related Articles
It’s not quite a ‘buyer’s market’ — but some indicators shows competition is cooling in the Bay Area housing market
29% fewer California homes sold. Is the Fed to blame?
Southern California home prices rise even as buying sputters
Top 10 home deals the week of April 14 in Saratoga
Which Milpitas homes had the best prices the week of April 14?
Why the slip? Well, real estate anxieties ran high as 2025 began.
The new White House administration rapidly imposed what you could call non-traditional economic policies. Then there were those lofty mortgage rates. The job market looked wobbly, too.
So house hunters balked. U.S. home sales in 2025’s first three months were the lowest in 10 years, according to Attom data.
Still, such price dips are rare. My trusty spreadsheet’s peek at Case-Shiller history dating to 1987 shows only 82 of the 458 months had price declines. That’s 18%.
Plus, this modest crack in pricing comes from Case-Shiller math, which smooths out housing’s gyrations. It’s a three-month average tracking only the marketplace’s “core” product: existing, single-family homes. Additionally, calendar-linked swings are dampened.
You know, we’re talking about one of the industry’s favorite yardsticks. So the dip’s buzz factor is real.
Yes, the index remains up 3.4% in a year and 59% since pre-pandemic March 2019. That’s solace for those who root for rising prices.
Broad slip
Case-Shiller’s national index has a statistical cousin that follows limited data, akin to Wall Street’s venerable Dow Jones 30-stock industrial index.
Case-Shiller’s 20-city composite index tracks 20 big U.S. housing markets, including three in California. The “seasonally adjusted” reading for March also showed a one-month dip – but just 0.1%. It was also its first decline since January 2023. The index has risen 4.1% in the year and 58% since 2019.
Pondering the 20 cities inside the index reveals a modestly broad drop.
For March, 14 cities showed one-month losses. That’s the highest number of declining markets for a month since December 2022. Note that an average month has five declines within the 20-city composite, an index that dates to 2000.
It’s not just housing. Peek at the Dow and you’ll see recent skittishness, too.
The stock index, using three-month averages, was down 0.8% in March and 0.4% in February, the first dips since March through June 2024. The Dow is 8% higher in a year and up 61% in six years.
California spin
San Francisco was March’s biggest loser among the 20 cities, down 1.4% in the month. It was the market’s decline since July 2024.
San Diego was down 0.8%, the third-biggest decline of the 20. That followed a 0.4% drop for February. San Diego’s last back-to-back dip was during the last two months of 2023.
The California trend-bender was Los Angeles and Orange counties, where prices rose 0.1% in March, the fifth-best performance. Its last decline was in September 2024.
The longer view shows significant California gains.
San Francisco is up 1.6% for the year and 36% since 2019. San Diego rose 1.6% in 12 months and 72% in six years. And L.A.-O.C. is up 4.1% in the year and 60% since 2019.
Jonathan Lansner is the business columnist for the Southern California News Group. He can be reached at [email protected]